LA Industrial Market Report
Market Research
December 2024 · approx.
Overview
Fall 2024 • RED 435
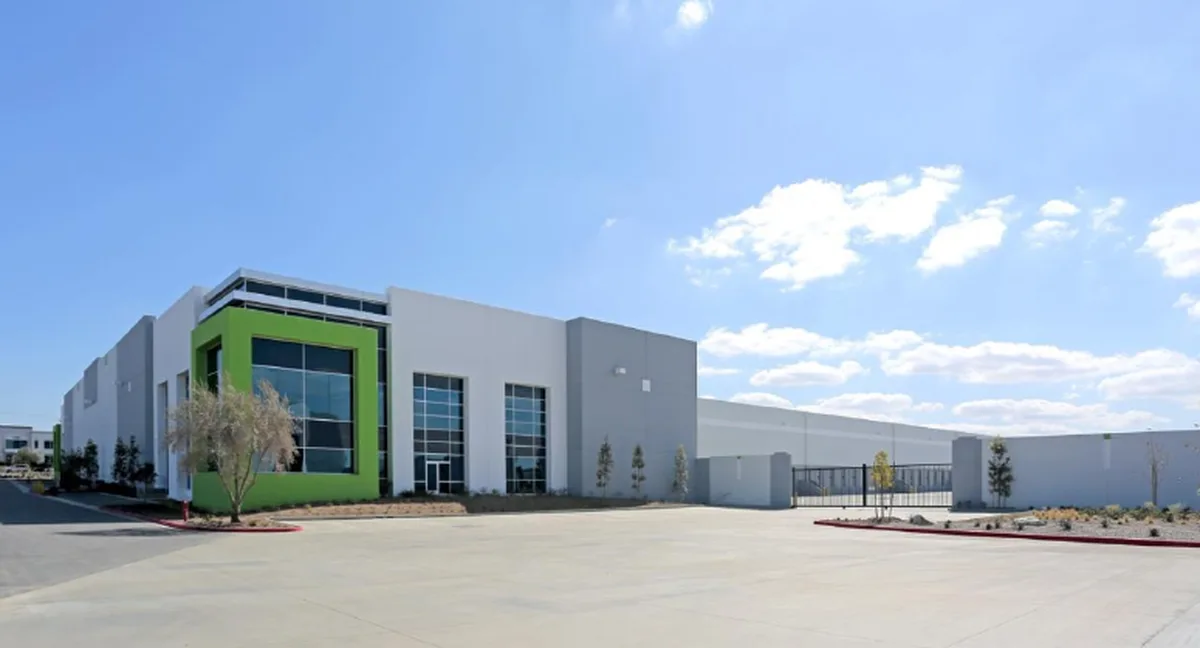
Industrial Market Analysis & Investment Evaluation: Class A Distribution Facility, Santa Fe Springs, California.
40-page market research and acquisition analysis of a $112M Class A industrial property in Los Angeles, covering regional economics, competitive positioning, and projected returns.
Project Overview
Acquisition analysis of a Class A logistics asset in Greater Los Angeles
Assignment
The assignment was to evaluate a $112M purchase of a Class A distribution facility in Los Angeles. Its tenant lease ends in 2028, leaving the full building to be leased in a market with rising vacancy and falling rents.
Analysis
I reviewed Los Angeles County population and employment, the regional industrial market, Mid-Counties vacancy and rents, comparable sales, and the property's underwriting. I also tested the assumptions against leasing, market, and financing risks.
Key Findings
The building was completed in 2018, has 36-foot clear heights, and is LEED certified. The model projected an 8.53% IRR. Mid-Counties vacancy reached 6.0%, up from 0.8% in 2022, rents were down 17% from their peak, and the tenant lease ends in 2028. I recommended passing at $112M ($277/SF) and reconsidering near $250/SF.
- RED 435: Analyzing Real Estate MarketsCourse
- University of Southern CaliforniaInstitution
- Fall 2024Semester
- 40-Page ReportAnalysis Scope
- 12588 Florence Ave, Santa Fe Springs, CAProperty Location
- Class A Industrial DistributionAsset Class
Market Research & Analysis
Regional economics, market dynamics, and submarket fundamentals
Los Angeles Industrial Market Overview
The Greater Los Angeles industrial market (954M SF) is experiencing cyclical correction after pandemic-era tightness. Market vacancy increased from historic low of 1.7% (2022) to 3.8% (Q3 2024) with seven consecutive quarters of negative absorption totaling 2.8M SF. Asking rents declined 17% from 2023 peak ($19.05 to $17.97 PSF), with landlords offering increased concessions (4-5 months free rent on 5-year terms).
However, structural factors suggest underlying market health. New construction remains limited at 6.2M SF (0.65% of inventory) due to land constraints: less than 5% of LA industrial inventory was built in the past decade versus 17% nationally. Port activity rebounded 14-15% year-over-year, indicating strengthening trade flows. Leasing activity improved to 11.9M SF in Q3 2024 (highest since Q3 2021), suggesting potential stabilization.
| Year | Vacancy Rate | Asking Rent PSF | YoY Rent Growth | Net Absorption (SF) |
|---|---|---|---|---|
| 2021 | 1.9% | $14.24 | 11.0% | +8.2M |
| 2022 | 2.7% | $15.79 | 10.9% | +4.1M |
| 2023 | 3.5% | $19.05 | 20.6% | -1.5M |
| 2024 | 6.2% | $17.97 | -5.7% | -2.8M |
Santa Fe Springs Submarket Dynamics
The Mid-Counties/Santa Fe Springs submarket (103M SF) experienced dramatic vacancy increase from 0.8% (2022) to 6.0% (Q4 2024) with negative absorption of 1.6M SF year-to-date. Market rents declined 16.8% year-over-year to $16.21 PSF. Several significant tenant move-outs drove softness: Marathon Distribution (195K SF), Daiso (220K SF headquarters), GA Gertmenian (133K SF), and Shift (153K SF).
I-5 and I-605 connect the submarket to Los Angeles and Orange Counties. The Ports of LA and Long Beach are 18 miles away, and BNSF intermodal facilities are nearby. The area has modern industrial buildings with 36-foot clear heights. Only 588K SF was under construction across five buildings. These access and supply conditions may support demand, but vacancy and rents had weakened by Q4 2024.
Regional Economic Analysis
LA County population declined from 10.01M (2020) to 9.78M (2024), representing 2.3% decrease with projected continued decline of 0.10% annually through 2030. However, employment market shows resilience with 5.04M labor force (4.62M employed) growing 1.3% month-over-month. Unemployment at 5.7% (above national 4.2%) but improving. Median household income of $87,260 (15% above the national average) points to a consumer base that supports e-commerce and distribution demand.
Trade, Transportation & Utilities had a location quotient of 1.08 and was projected to add 99,400 jobs from 2020 to 2030, a 12.6% increase. That growth could add 7–10M SF of industrial demand. The Ports of LA and Long Beach handle about 40% of U.S. imports. Population decline remains a concern, while employment forecasts point to continued demand from logistics users.
Property & Competitive Analysis
Evaluation of physical specifications, location advantages, and competitive positioning
Property Strengths
- Modern 2018 construction with institutional specifications
- 36-foot clear heights
- LEED certified
- 52 dock-high doors + 2 drive-in doors (excellent loading)
- 185-foot truck court depth for operations
- 2 miles to the I-5/I-605 interchange
- 18 miles to Ports of LA/Long Beach
- Single tenant through 2027 (stable near-term cash flow)
Competitive Position
- One of only two 5-star properties in comp set
- Superior to older vintage competitors (2006-2010 built)
- Clear height matches market best (36' vs 30-37' range)
- Excellent loading ratio (1 dock per 7,650 SF)
- Central location between LA and Orange County
- Professional institutional ownership (Goodman)
- Modern building systems and sustainable design
- Limited new competing supply in submarket
Key Challenges
- Limited parking ratio (0.37/1,000 SF vs market standard)
- Only 149 spaces may restrict certain user types
- Fashion Nova vacating Dec 2027 (full lease-up required)
- Competition from newer 2021 development (2400 E Artesia)
- Rising submarket vacancy (6.0% vs 0.8% in 2022)
- Market rent decline (17% from peak)
- Car-dependent location (Walk Score 31)
- Subject to CA environmental regulations
Competitive Set Comparison
| Property | Size (SF) | Built | Clear Height | Loading | Rating |
|---|---|---|---|---|---|
| 12588 Florence (Subject) | 397,560 | 2018 | 36' | 52 DH + 2 DI | 5-Star |
| 2400 E Artesia Blvd | 415,312 | 2021 | 36' | 66 DH | 5-Star |
| 2101 W Flotilla St | 322,406 | 2010 | 32' | 66 DH | 4-Star |
| 17411 Valley Blvd | 342,225 | 2007 | 30' | 45 DH + 2 DI | 4-Star |
| 13222 Freeway Dr | 391,000 | 2006 | 30' | 52 DH | 4-Star |
The property has 36-foot clear heights, 2018 construction, and a five-star rating. Primary competition from 2400 E Artesia (newer 2021 build) but subject's central location and established market position provide distinct advantages over older vintage competitors.
Financial Analysis & Investment Returns
Cash flow projections, investment returns evaluation, and sales comparable analysis
Investment Returns Summary
Built 5-year cash flow projection incorporating current Fashion Nova lease through 2027 ($1.20 PSF with 4% annual escalations), followed by 6-month lease-up period with market rent assumptions of $1.64 PSF starting January 2028. Operating expenses projected at $3.85 PSF (property taxes $3.00, insurance $0.30, CAM $0.35, management $0.20) with 3% annual growth.
Investment Returns: Initial cap rate of 4.9% reflects below-market in-place lease and mark-to-market opportunity. Projected IRR of 8.53% with 1.36x equity multiple based on 6.0% exit cap rate and $131.9M sale price in Year 5. Total anticipated profit of $40.4M. However, projected returns provide minimal cushion above 8.0% target, insufficient to compensate for market risks, leasing uncertainty, and tenant rollover exposure.
| Metric | Value | Commentary |
|---|---|---|
| Purchase Price | $112,000,000 | $277.48 per SF basis |
| Year 1 NOI | $5,444,027 | Below-market in-place rent |
| Initial Cap Rate | 4.9% | Below market average (5.3%) |
| Projected IRR | 8.53% | Marginally above 8.0% target |
| Equity Multiple | 1.36x | 5-year hold period |
| Exit Cap Rate | 6.0% | May be optimistic given market trends |
| Year 5 Sale Price | $131,900,000 | $331.61 per SF |
Sales Comparable Analysis
I compared the proposed $112M purchase with recent sales. Modern Class A properties traded at $369–384/SF, though they were generally smaller. Santa Fe Springs comparables traded at 5.1–5.9% cap rates. Greenlaw Partners bought similar-vintage properties for $295/SF at a 5.1% cap rate in August 2024.
At $277/SF, the proposed price was close to recent trades while vacancy was rising, rents were falling, and absorption was negative. I estimated that a price near $250/SF would better reflect those conditions.
Risk Assessment & Recommendation
Market, leasing, and capital markets risks
Market & Vacancy Risk
- Submarket vacancy increased from 0.8% to 6.0% (2022-2024)
- Seven consecutive quarters negative absorption
- Large logistics facilities (250K-500K SF) showing 8% vacancy
- 1.6M SF negative absorption year-to-date in submarket
- Tenant rightsizing/move-outs across submarket
- Full building lease-up required in 2028
Rental Rate Risk
- Market rents declined 17% from 2023 peak
- Submarket rents down 16.8% year-over-year
- Effective rents declining 25% with concessions
- 4-5 months free rent common on 5-year terms
- $1.64 PSF market rent assumption may be aggressive
- Current Class A range: $1.50-$1.75 PSF
Capital Markets Risk
- Cap rates expanded 100+ bps to mid-5% range
- 6.0% exit cap assumption may prove optimistic
- Rising interest rates pressuring valuations
- ULA transfer tax (4-5.5%) on sales over $5M
- Limited transaction velocity in current market
- Inflation pressuring operating expenses
Investment Recommendation
RECOMMENDATION: PASS AT CURRENT PRICING
I recommended passing at $112M ($277/SF). The model projected an 8.53% IRR and required leasing the full building when the tenant leaves in 2028. The rent assumptions also appeared aggressive for the market at the time.
Key decision factors: The initial 4.9% cap rate was below the 5.3% market average. Absorption was negative for seven consecutive quarters; vacancy reached 3.8% across the market and 6.0% in the submarket. Rents had fallen 17% from peak, concessions had increased, and the model used a 6.0% exit cap rate. The tenant's 2028 departure would leave the full property to be leased.
Price to reconsider: I would revisit the acquisition near $250/SF. I would also favor properties with leases extending beyond the near-term market uncertainty.
Project Deliverables
Documentation and analysis materials
Full Investment Memo
Complete 40-page analysis covering regional economics, market fundamentals, property evaluation, competitive positioning, financial projections, and investment recommendation.
Download ReportExecutive Summary
Two-page summary of the investment overview, key metrics, property strengths and challenges, market conditions, and the final recommendation.
View SummaryMarket Data Analysis
Detailed market fundamentals tables, vacancy/rent trend analysis, competitive set comparison, economic indicators, and submarket performance metrics with supporting commentary.
View Data